Page 42 of 107
Re: News & Discussion: Electricity Infrastructure
Posted: Thu Nov 07, 2019 7:36 pm
by Goodsy
Jaymz wrote: ↑Thu Nov 07, 2019 7:19 pm
Goodsy wrote: ↑Thu Nov 07, 2019 5:12 pm
PeFe wrote: ↑Thu Nov 07, 2019 4:34 pm
Tailem Bend Solar farm was built and planned for the South Australian market, the NSW interconnector was a far flung idea at the time.
Having said that there is also Heywood Connector which enables South Australia to export (max 650mw) into the National Electricity Market.
I am waiting to see the latest export figures, anecdotally I can tell you from looking at NEM chart each day (that details energy generation and export) that South Australia has spent autumn, winter and spring exporting electricity, mostly to Victoria is my guess.
The SA-NSW interconnector will be a milestone for renewable energy in South Australia when it is built, adding another 750mw in export capacity.
This has the potential for another boom in solar/wind farms and batteries. The Neoen proposal at Burra is particularly exciting (scrawl back in the posts to find it...)
We export to Victoria and then Victoria can export it on to NSW
Is it really that simple?
Like I said, i'm a novice on this topic. So what you're saying, Victoria is exporting S.A's surplus electricity from renewables to NSW?
It's a very simplified explanation, the market is very complicated.
Right now SA and Tas are exporting to Victoria, while Victoria is exporting to NSW.. However NSW is also exporting to QLD.
and Vic is exporting to SA via the Murray Link
https://www.aemo.com.au/Electricity/Nat ... h-overview
Re: News & Discussion: Electricity Infrastructure
Posted: Thu Nov 07, 2019 9:21 pm
by SRW
Re: News & Discussion: Electricity Infrastructure
Posted: Thu Nov 07, 2019 11:23 pm
by SBD
PeFe wrote: ↑Thu Nov 07, 2019 3:35 pm
The problem may well lie with the business model Tailem bend Solar Farm are operating under. Sounds like they rely too much on the "spot" price ie the price electricity will go for on the open market when demand goes up (most extreme case scenario, summer heat wave where $14,000 mwh is the maximum allowed price)
Other solar farms rely on a different model where you enter into a long term contract to supply electricity (at a greatly reduced price compared to the "spot" price)
If the Desal plant needs 50mw they wont be buying it on the open market each day, they will do a 6 month contract with a retailer ( or apply to the Consumer Commission for permission to do a direct deal with a producer)
I don't think it is the solar farm that is relying on the spot price. As I understand it, there is a 100% offtake agreement with Snowy Hydro (Lumo Energy), and that contract essentially says "we don't want your electricity when someone else will pay us to take theirs".
If the desalination plant can be turned on and off quickly enough, it could operate as a money spinner for the state government by only operating while the wholesale price is negative - it would be paid to consume excess electricity and paid for the water produced as well.
Re: News & Discussion: Electricity Infrastructure
Posted: Fri Nov 08, 2019 7:56 am
by Norman
I was under the impression that the desalination plant had its own solar panel array on site that it uses to power the plant.
Re: News & Discussion: Electricity Infrastructure
Posted: Fri Nov 08, 2019 8:21 am
by SRW
Norman wrote: ↑Fri Nov 08, 2019 7:56 am
I was under the impression that the desalination plant had its own solar panel array on site that it uses to power the plant.

It has one but it's nowhere near enough energy to power the plant.
Re: News & Discussion: Electricity Infrastructure
Posted: Fri Nov 08, 2019 1:19 pm
by rev
SRW wrote: ↑Fri Nov 08, 2019 8:21 am
Norman wrote: ↑Fri Nov 08, 2019 7:56 am
I was under the impression that the desalination plant had its own solar panel array on site that it uses to power the plant.

It has one but it's nowhere near enough energy to power the plant.
I wonder how much capacity they could fit in that empty dirt patch in the photo.
Re: News & Discussion: Electricity Infrastructure
Posted: Fri Nov 08, 2019 2:39 pm
by Goodsy
rev wrote: ↑Fri Nov 08, 2019 1:19 pm
SRW wrote: ↑Fri Nov 08, 2019 8:21 am
Norman wrote: ↑Fri Nov 08, 2019 7:56 am
I was under the impression that the desalination plant had its own solar panel array on site that it uses to power the plant.

It has one but it's nowhere near enough energy to power the plant.
I wonder how much capacity they could fit in that empty dirt patch in the photo.
According to Google Earth the area out the front is about 18 acres.
So if this website
https://greencoast.org/solar-farm-land- ... r_Megawatt is anything to go by, it could have 6,426MWh per year
Re: News & Discussion: Electricity Infrastructure
Posted: Sat Nov 09, 2019 1:15 am
by bits
I saw people on Facebook claim it would use 46.25MW/day at 100% capacity. I think they pulled that from the wiki page.
46.25 * 365 = 16,881.25MW/year
Re: News & Discussion: Electricity Infrastructure
Posted: Sat Nov 09, 2019 9:50 am
by Goodsy
bits wrote: ↑Sat Nov 09, 2019 1:15 am
I saw people on Facebook claim it would use 46.25MW/day at 100% capacity. I think they pulled that from the wiki page.
46.25 * 365 = 16,881.25MW/year
which is 405,150MWh per year, so solar plant on the dirt out front would provide 1/63 of the power required
Re: News & Discussion: Electricity Infrastructure
Posted: Tue Nov 12, 2019 1:40 pm
by PeFe
Another record low power demand on a weekend in South Australia.
from Renew Economy
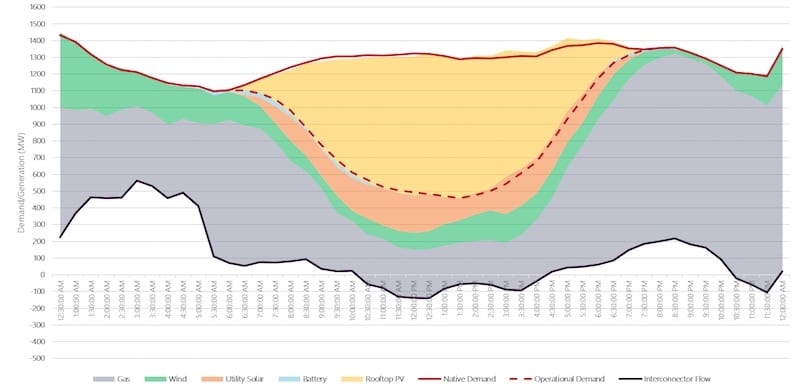
Rooftop solar delivers yet another record low in grid demand for South Australia
Rooftop solar has delivered a new low in South Australia’s electricity demand over the weekend – the third minimum grid demand record to fall in the state in a month, according to the Australian Energy Market Operator.
AEMO says a new minimum operational demand of 458MW was recorded at 13:30pm on Sunday November 10, replacing the previous summer minimum record set in December 2018.
The new low (the red dotted line in graph above) follows the October 21 record low of 475MW, which itself came one week after rooftop and large scale solar combined to deliver 80 per cent of South Australia’s total demand, and two weeks after the state set a previous record low.

“This is yet another minimum demand record… set in South Australia and a strong signifier of how rapidly Australia’s power system is evolving,” AEMO says on its Energy Live blog.
And while the record was achieved on a Sunday, AEMO stressed that the state’s major industrial businesses were at typical operating loads at the time.
AEMO defines operational demand as the amount of power consumers require from Australia’s wholesale energy markets, not including power consumed from behind-the-meter resources, like rooftop PV.

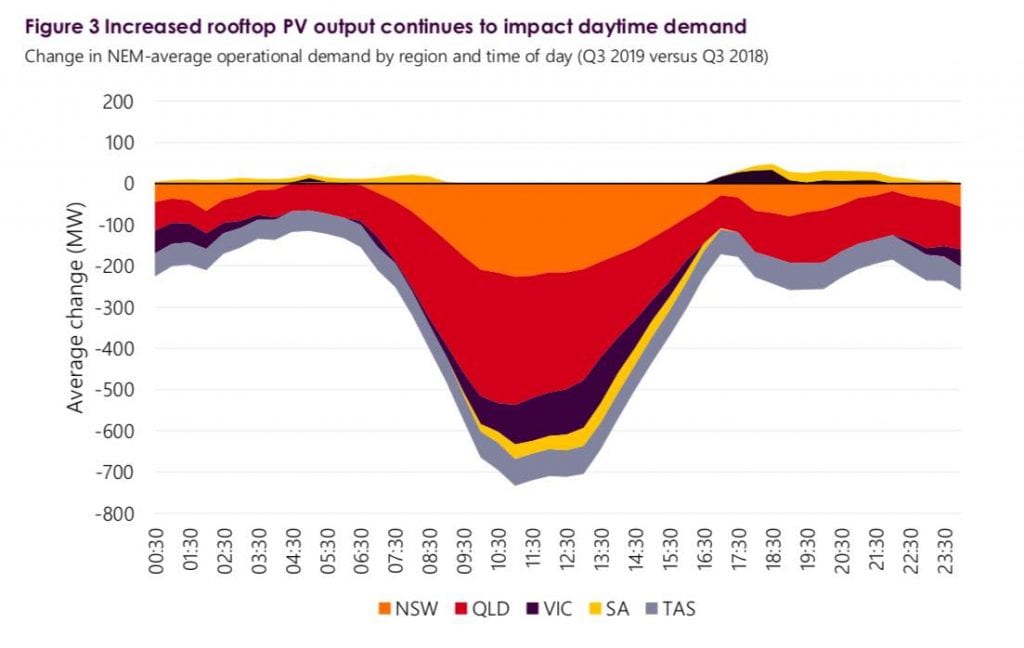
It’s not just South Australia experiencing changes to day-time demand. As we explain in this story – Negative pricing events hit record levels as solar takes big bite out of coal – rooftop solar is eating out midday demand in other states too and across the grid in general.
As AEMO explained on Monday, increased rooftop solar generation in the state is lowering the middle of the day demand, and shifting both minimum and maximum operational demand to later in the day.
“While these new records are certainly attention grabbing, that does not mean they’re without challenges,” AEMO said in the blog post.
“The increasing contribution of behind-the-meter resources to our power system has meant that managing key system requirements, such as frequency and voltage, can become more difficult.”
Full article :
https://reneweconomy.com.au/rooftop-sol ... lia-69609/
Re: News & Discussion: Electricity Infrastructure
Posted: Tue Nov 12, 2019 11:04 pm
by Spurdo
Application has been lodged by Nexif to move the first lot of gas turbines to Outer Harbour.
Development No: 040/V052/19
Name: Port Adelaide Energy Pty Ltd C/- Nexif Energy
Description: Commissioning of five trailer-mounted gas turbine generators (approx. 154 MW), 600kL diesel fuel storage, ancillary infrastructure and associated earthworks
Address: Lot 205 Pelican Point Road, Outer Harbor
Date Lodged: 23/10/2019
Re: News & Discussion: Electricity Infrastructure
Posted: Wed Nov 13, 2019 11:44 am
by kingy
Goodsy wrote: ↑Sat Nov 09, 2019 9:50 am
bits wrote: ↑Sat Nov 09, 2019 1:15 am
I saw people on Facebook claim it would use 46.25MW/day at 100% capacity. I think they pulled that from the wiki page.
46.25 * 365 = 16,881.25MW/year
which is 405,150MWh per year, so solar plant on the dirt out front would provide 1/63 of the power required
There are currently plans to install solar panels there under the SA Water ZCEF project.
https://saplanningcommission.sa.gov.au/ ... 9_V2_1.pdf
From the document:
- 16.7ha to be covered
- Approximately 22,560 indivual solar PV cells, each measuring approximately 1900mm long x 992mm wide and 50mm thick (Note: final panel size and configuration will be subject to detailed design and panel supplier selection processes)
Re: News & Discussion: Electricity Infrastructure
Posted: Wed Nov 13, 2019 3:22 pm
by TorrensSA
Where are you getting the 405,150MWh per year from? The plant is using 46.25 Mw a day, therefore you get 46.25 / 24 = 1.93MWh. The calculation to get to 405,150 is assuming it's using 46.25MWh, theres 8760 hours in a year so 46.25 x 8760 is 405.150. 1.93MWh = 1930KWh. Adelaide consumes about 1200MW each hour, the plant is not using 4% of Adelaides power.
Re: News & Discussion: Electricity Infrastructure
Posted: Wed Nov 13, 2019 11:35 pm
by Aidan
TorrensSA, Goodsy, bits
Megawatts are a unit of power, not energy.
Unless power use changes, a megawatt per day is the same as a megawatt per year or a megawatt per second.
To get the figure for energy, multiply by the number of hours to get megawatt hours. Alternatively, multiply by the number of seconds to get megajoules.
Re: News & Discussion: Electricity Infrastructure
Posted: Wed Nov 13, 2019 11:43 pm
by SBD
The
Wikipedia article does not say how much power (MW) or energy (MWh) the desalination plant uses per day/year.
It does say "The plant uses 3.47 to 3.70 kilowatt-hours of electricity per kilolitre of water produced.", cited to an article on the
Australian Water Association website.
So if we pick the midpoint as 3.6kWh/kL, that is 3.6MWh/ML, and 3600MWh/GL, or 360,000 MWh to produce 100GL of water in a year at full production, or an average power draw of just over 41MW (360,000/365/24) sustained all day and all night. That is 3.4% of 1200MW.


